I love playing music, primarily guitar and piano (Fun fact, I was a music composition minor!). I’ve always been fascinated by theory and I finally sat down to visualize what is happening when notes are put together. I wouldn’t have imagined these intervals would look this way. Audibly these sounds go together like butter, visually it takes some interpretation.
Here I graph several common intervals (m2, M2, M3, P5), the major chord and the minor chord, to get another perspective of what makes music so magical. Notice that these intervals are formed from simple ratios. The Tonic frequency, sin(x), is added to the interval, sin(harmonic_ratio*x). I scaled the amplitude by 5 times so that it is easier to see. My resources were https://www.desmos.com/calculator and http://www.sengpielaudio.com/calculator-notenames.htm


The Octave (1,8)

Perfect 5th

Major Chord (1,3,5)

Major Chord (1,3,5) viewed with Minor Chord (1,b3,5)

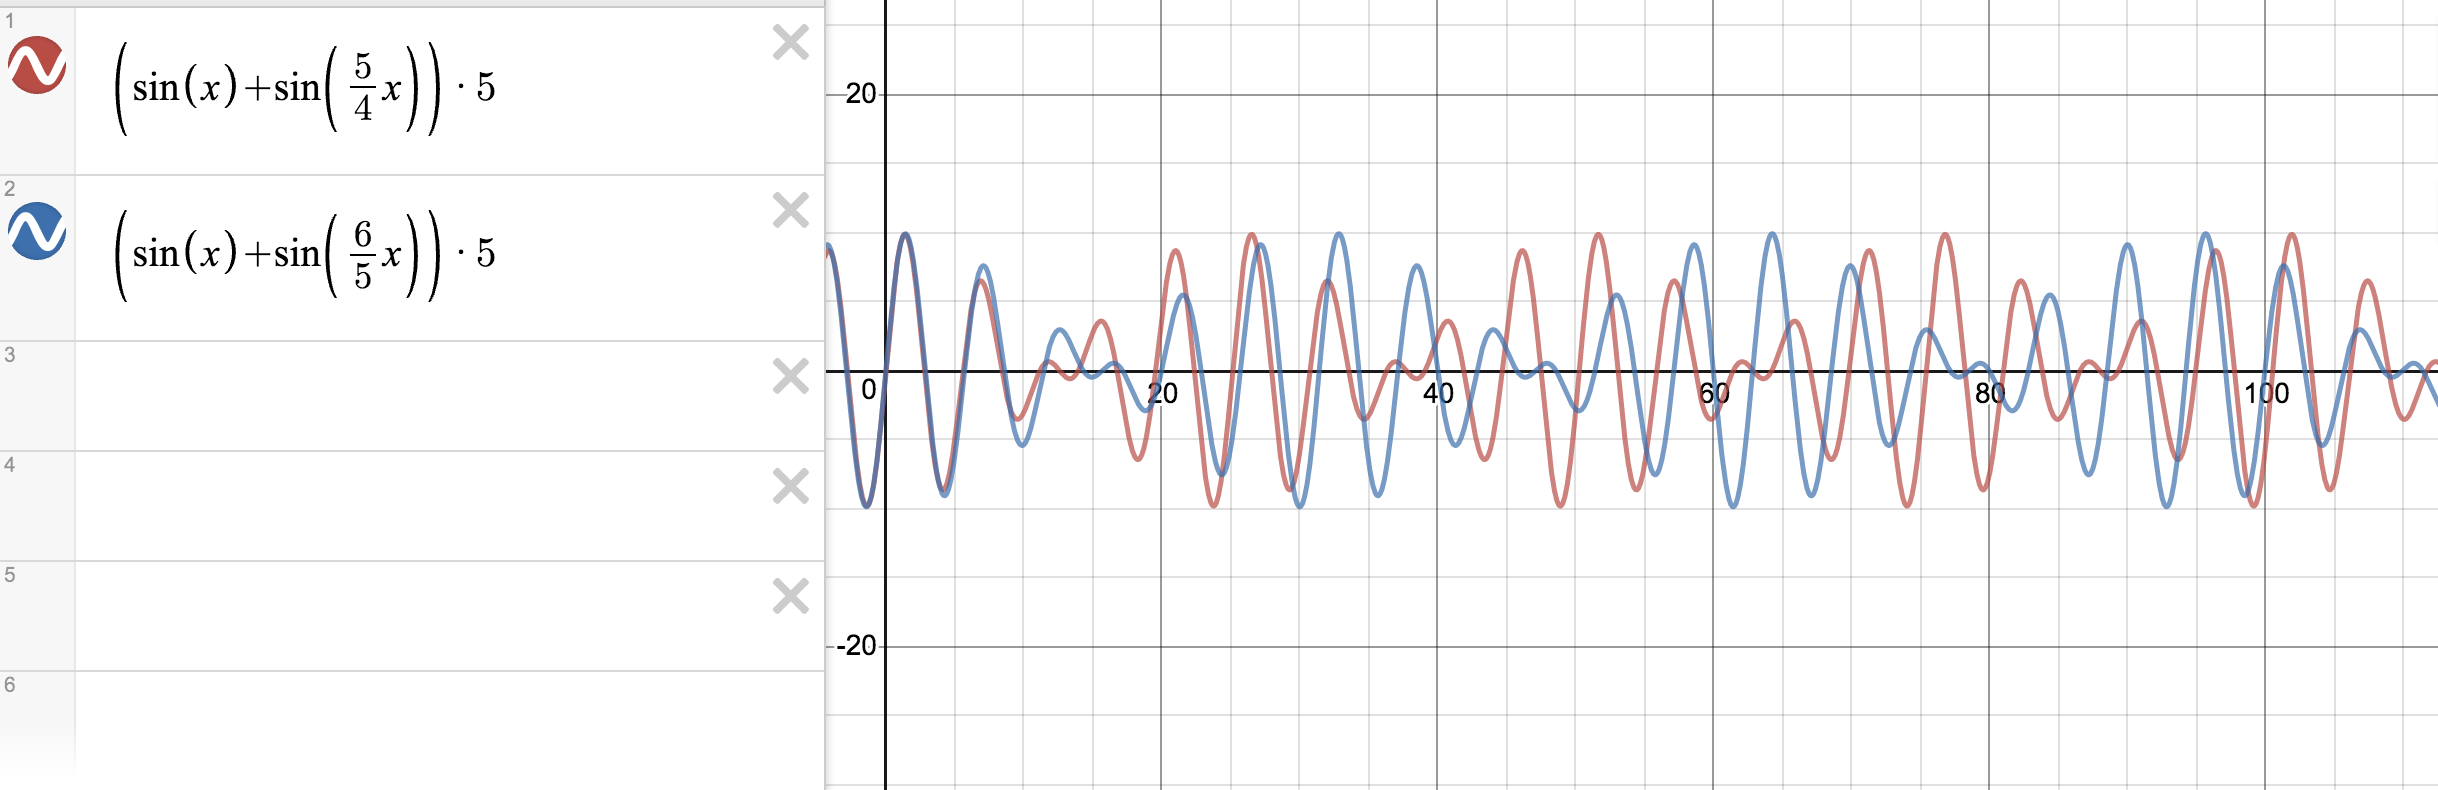
Minor 2nd. Ratio is 16/15. Oh that beat frequency!

Major 2nd. This is strangely much more tolerable than the minor2nd, creating a multiple of 8

Major 3rd. This is the ‘happy’ interval… I suppose much of it really is socialization to the sound
Major 3rd viewed with Minor 3rd

The tritone is the only musical interval that is the same ratio within Equal Temperament and Just Temperament. (i.e Piano or an instrument that can play in any key versus a trumpet or instrument that has fixed harmonies in one key)